The international scientific and analytical, reviewed, printing and electronic journal of Paata Gugushvili Institute of Economics of Ivane Javakhishvili Tbilisi State University
Evaluation of the use of budgetary costs to improve the economic role of the State
Summary. Over the last years, the position of the Country concerning the development of national economy of Azerbaijan has been assessed positively in several international rankings on the background of measurements performed by the government. It should be noted that the orders and decrees adopted by the President of the Republic of Azerbaijan in this direction should be emphasized. So, as an example we can show the Decree "On additional measures to improve the business environment in the Republic of Azerbaijan and further improvement of our country's position in international rankings", issued on July 13, 2016 and the Decree “On national economy and strategic roadmaps for 11 sectors of economy”, issued on December 6, 2016. The targets have been determined in regard to decrease in oil dependence of the economy of the country, development of small and medium-sized businesses to make the national economy more competitive and appropriate steps are being taken. In particular, the measures taken to improve the business and investment climate should be assessed positively. The aforementioned processes will undoubtedly improve the country's economy in international rankings on various development indicators.
Among the measures to be taken, the state's role in economic processes should be more effective, especially the fiscal policy. It should be taken into consideration that the main force here falls on government spending . Optimization of expenditure and improved efficiency in use will result in improved positioning of country's economy in various ratings, including economic freedom ratings.
It is stated in the Strategic Roadmap that the budgetary requirements will be linked to clearly defined objectives as well as performance indicators to ensure efficiency in government spending [2, p.46]. Undoubtedly, the definition of the "golden rule" in the use of oil revenues has made actual optimization of government spending in this regard. Here, both the public debt management and the achievement of the dynamics in budget revenues have identified the "necessary fiscal framework" as the primary goal. These issues are considered as the key provisions in the Strategic Roadmap, and it is important to ensure efficiency in government spending in the context of more active budget management and alignment of its results with budgetary organization [2, p.55].
Keywords: Fiscal policy, government spending, budgetary costs, forecasting, GDP, correlation, dependency, Eviews application.
Introduction
Government spending is considered to be an economic tool that has a strong impact on macroeconomic processes. In addition to the economic content of government spending, plays an important role in the realization of social, political, socio-cultural and etc. processes. A commonly accepted case is that the government spending should be directed to the most efficient and profitable sectors. However, the events occurring in the socio-economic, socio-political and natural environment of the country result in a sharp rise ingovernment spending, which in turn leads to serious economic consequences. That is why, it is very important to use government spending and determine its size as accurately as possible. In this aspect, international rating agencies around the world conduct certain calculations and determine the indices.
The general approach states that the assessment of government spending is of relative character. So while the government spending on economic freedom seems minimal, it has more negative consequences, or, conversely, a greater proportion of government spending in GDP than 30%, which aggravates its position on economic freedom. It is therefore advisable to establish an acceptable “interval limit” for government spending .
The following formula is used in the calculation of government spending :
DXi = 100 - α (costsi)2
Here:
• DXi- Cost of government spending in i country;
• costsi - the percentage of average government spending in GDP over the last 3 years;
• α- is a coefficient equal to 0.03 [4].
Main part. Since 2015, as with a number of economic indicators, there has been a decline in budget spending. The decline in oil revenues, resulting in a reduction in budget transfers, has in turn led to a significant reduction in spending structure. Thus, the budgetary costs in 2014 were 18.7 billion manat, while in 2017 the minimum level was 17.5 billion manat. In 2015 and 2016, it was 17.7 billion manat, respectively. In 2018, the highest level of the last 5 years was recorded, which amounted to 23.1 billion manat. Undoubtedly, the stability in manat exchange rate, positive dynamics of macroeconomic indicators and measures for development of non-oil sector should be emphasized in this aspect. Besides, the increase in budget spending with the expansion of structural reforms is one of the key points that draw attention.
The static situation in the structure of budgetary costs for 2014-2017 is presented in Chart 1 (see Chart 1).
Chart 1
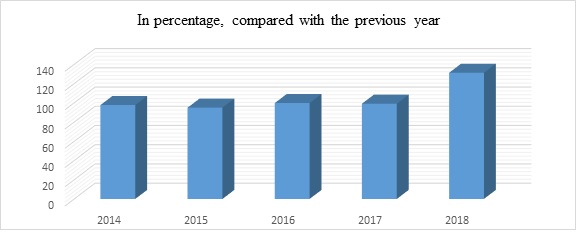
Source: [8]
As can be seen from the Chart that there has been a significant increase in budget spending for 2018. The key provision for this factor is that 2018 was a major breakthrough in key sectors of the national economy. Accordingly, budgetary costs were 97.7 percent compared to the beginning of 2014, 95.0 percent in 2015, 99.8 percent in 2016, 99.1 percent in 2017 and 131.3% in 2018, respectively.
It becomes clear when considering the specific weight of budgetary costs in relation to GDP, that the change of level of GDB in the last 5 years on the background of non-linear fluctuation formed a non-linear chart (see Chart 2).
Dynamics of budget expenditures. Chart 2
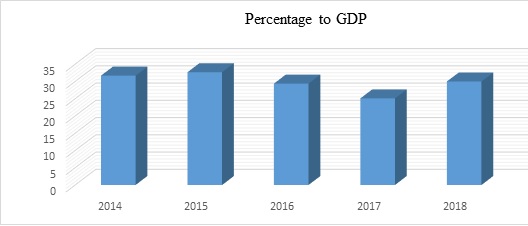
Source: [8]
It was 31.7 percent in 2014, 32.7 percent in 2015, 29.4 percent in 2016, 25.1 percent in 2017 and 30.0 percent in 2018, respectively. However, the share of budgetary costs in GDP for the next years is forecasted to decline. The main reason for this factor is structural reforms in the country. Thus, according to the Decree of the President of the Republic of Azerbaijan dated January 14, 2019 "On Additional Measures on Improvement of the State Governance in the Republic of Azerbaijan", a number of budget-financed organizations have been identified as self-financing and public-sector activities. This means a satisfactory saving of budgetary costs [6].
Chart 3
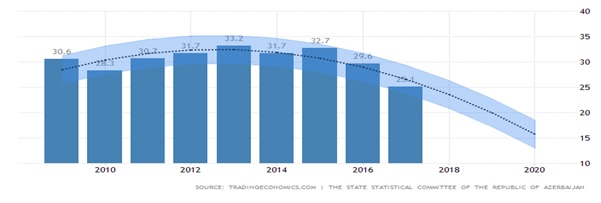
Source: [5]
As it is seen from the presented Chart, it is forecasted by international rating agencies that budgetary costs will not rise significantly in relation to GDP. Thus, it is forecasted from 25.1 percent-level (for 2017) to 26.1 percent-level (in 2020). It becomes clear when compared to GDP forсasting that in 2017, the growth was 1.8% compared to 2017 -a 2.8% increase compared to the previous year was forecasted in 2020 compared to previous year for 1,4% compared to 2017. By using the statistics of GDP and budgetary costs for statistical figures on 18 years, we will determine the level of dependence between both indicators.
Budgetary costs on GDP and budgetary costs (in million manats)
Table 1
|
Years |
GDP (in million manats)-y |
Budget costs (in million manats)-x |
|
2000 |
4118,1 |
764,0 |
|
2001 |
5315,6 |
807,5 |
|
2002 |
6062,5 |
931,8 |
|
2003 |
7146,5 |
1234,5 |
|
2004 |
8530,2 |
1502,1 |
|
2005 |
12522,5 |
2140,7 |
|
2006 |
18746,2 |
3790,1 |
|
2007 |
28360,5 |
6086,2 |
|
2008 |
40137,2 |
10774,2 |
|
2009 |
35601,5 |
10503,9 |
|
2010 |
42465,0 |
11765,9 |
|
2011 |
52082,0 |
15397,5 |
|
2012 |
54743,7 |
17416,5 |
|
2013 |
58182,0 |
19143,5 |
|
2014 |
59014,1 |
18709,0 |
|
2015 |
54380,0 |
17784,5 |
|
2016 |
60425,2 |
17751,3 |
|
2017 |
70337,8 |
17594,5 |
|
2018 |
79797,3 |
22723,2 |
Source: [8]
The following chart can be created using the table data.
Chart 4
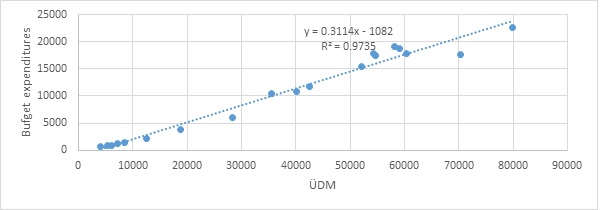
Note: The chart was drawn up by the authors.
As can be seen from the graph, there is a high correlation between budget expenditure and GDP, with the regression equation below y = 0.3114x – 1082 (1) below. R² = 0.9735
Since there is a high correlation between the dependent variables included in the model (1) and the correlation matrix in the MS Excel application software, as shown in Table (1), we have the following table:
Table 2
|
Y |
X |
|
|
Y |
1 |
|
|
X |
0,986657 |
1 |
As can be seen from the table, there is a very high direct correlation between the variables Y and X (R = 0.986).
Based on this correlation equation, we can conclude that a single increase in the factor (X), which represents the budget expenditure, it causes to a 0.31 unit increase of GDP.
Presence of aggregate correlation coefficient R = 0.98 indicates a very high correlation between the Y-dependent variable representing the total gain and the arbitrary variable (X) included in the model. Presence of determination coefficient R2 = 0.9735 means that the corresponding regression equation is explained by 97.3% dispersion result indicators and 2.7% by the impact of other factors. Presence of high deterministic coefficient indicates that the regression equation is better represented by the initial data and that the greater part of the causal factor (97.3%) is explained by the factors included in the model.
Schedule of GDP and budget expenditure change.
Chart 5
The following chart shows the dynamics of the Fitted and obtained (Actual) prices, as well as the residuals (Residual), based on the regression equation of the built-in model according to the Eviews application package application.
Chart 6
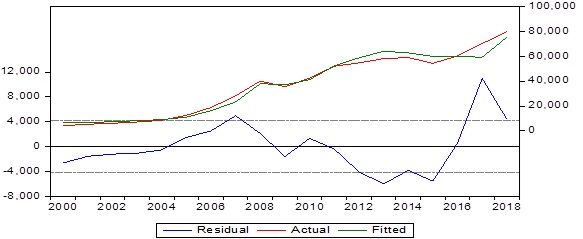
Source. The Eviews application was developed by the authors based on the software package.
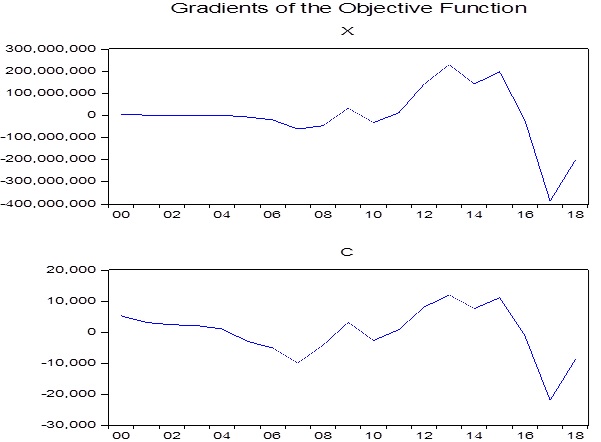
The following chart shows the values and standard errors in GDP with the regression equation derived from the Eviews software package, as well as a number of characteristics for using the equation for forecasting purposes.
Chart 7
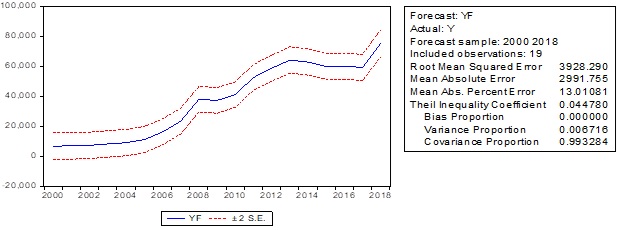
Source. The Eviews application was developed by the authors based on the software package.
By using this chart, it is also possible to estimate the forecasted prices of GDP in Azerbaijan.
|
Dependent Variable: Y |
|
|
||
|
Method: Least Squares |
|
|
||
|
Date: 09/23/19 Time: 14:57 |
|
|
||
|
Sample: 2000-2018 |
|
|
||
|
Included observations: 19 |
|
|
||
|
|
|
|
|
|
|
|
|
|
|
|
|
Variable |
Coefficient |
Std. Error |
t-Statistic |
Prob. |
|
|
|
|
|
|
|
|
|
|
|
|
|
X |
3.125729 |
0.125097 |
24.98635 |
0.0000 |
|
C |
4355.740 |
1608.431 |
2.708068 |
0.0149 |
|
|
|
|
|
|
|
|
|
|
|
|
|
|
|
|
|
|
|
R-squared |
0.973492 |
Mean dependent is available |
36735.15 |
|
|
Adjusted R-squared |
0.971933 |
S.D. dependent is available |
24788.84 |
|
|
S.E. of regression |
4152.942 |
Akaike info criterion |
19.60032 |
|
|
Sum squared residual. |
2.93E+08 |
Schwarz criterion |
19.69974 |
|
|
Log likelihood |
-184.2031 |
Hannan-Quinn criterion |
19.61715 |
|
|
F-statistic |
624.3175 |
Durbin-Watson stat |
0.887703 |
|
|
Prob(F-statistic) |
0.000000 |
|
|
|
|
|
|
|
|
|
|
|
|
|
|
|
Estimation Command:
=========================
LS Y X C
Estimation Equation:
=========================
Y = C (1)*X + C (2)
Substituted Coefficients:
=========================
Y = 3.12572921326*X + 4355.74016258
The dependence is quite high. The dependence between GDP and budgetary costs in the Republic of Azerbaijan is very high when using mathematical software packages - Eviews, which are ready for regression analysis. R2=0,973492
|
|
|
|
|
|
R-squared |
0.973492 |
|
|
The analysis and calculations showed that the dependence between GDP and budget spending is quite high. Even the increase in budgetary costs directly impacts on GDP growth. Therefore, in terms of improving our position on the index of economic freedom, the approach should not be unequivocal “in the case of approaching the issue of reducing the budget expenditures”.
Result. The Government of Azerbaijan has not yet chosen the goal of reducing the government spending to improve its position on the Index of Economic Freedom as a priority.
The assessment showed that the dependence on GDP and budget spending is quite high. Even the increase in budgetary costs directly impact on GDP growth. Therefore, in terms of improving our position on the index of economic freedom, the approach should not be unequivocal “in the case of approaching the issue of reducing the budget expenditures”. For the period examined in Azerbaijan's position on the Index of Economic Freedom, we can say that the possibilities of impact of the dynamics of change in government spending has been very weak.
References
- Order of the President of the Republic of Azerbaijan “On additional measures to improve the business environment in the Republic of Azerbaijan and further improvement of the position of our country in international rankings”. July 13, 2016
- “Strategic Roadmap for the Future of National Economy of the Republic of Azerbaijan”, approved by the Decree of the President of the Republic of Azerbaijan. December 6, 2016.
- https://gtmarket.ru/ratings/index-of-economic-freedom/index-of-economic-freedom-info
- https://azranking.az/az/ratings/
- https://ru.tradingeconomics.com
- The Decree of the President of the Republic of Azerbaijan “On additional measures for improvement of public administration in the Republic of Azerbaijan”. January 14, 2019.
- https://knoema.ru/atlas/topics/Economy/Financial-sector-Governmental-finance/General-expenses
- https://www.stat.gov.az/source/finance/