The international scientific and analytical, reviewed, printing and electronic journal of Paata Gugushvili Institute of Economics of Ivane Javakhishvili Tbilisi State University
ASSESMENT OF THE ASSOCİATİVE ACTİVİTY OF MARİTİME TRANSPORT AND PORT İNFRASTRUCTURE İN AZERBAİJAN
10.36172/EKONOMISTI.2021.XVII.03.TABRIZ.ABDULLA.OGLU.YADIGAROV
ABSTRACT
As part of the study, the Evievs software package compared and assessed the financial and economic activities of Azerbaijan Caspian Shipping Company CJSC and Baku International Sea Trade Port CJSC for 2014-2019. Here, using entropy, which is a measure of uncertainty, the potential for expanding freight traffic in the maritime transport sector over 31 years was determined, taking into account the volume and usefulness of information on freight traffic for the period 1990-2020. Also, according to the statements of Azerbaijan Caspian Shipping Company CJSC, the impact of the depreciation rate calculated on the linear depreciation method applied to ships for fixed assets in the amount of 25% was analyzed. The risk of capital investments in shares issued were assessed by “Oil Fleet” and CJSC “Baku International Sea Trade Port”.
Key words: sea transport, port infrastructure, capital investments, coefficient of variation, elasticity coefficient.
1. Introduction
Maritime transport is one of the leading sectors in the growth of maritime trade in the world economy, responding more quickly to economic and political changes in any region of the world, providing customer service functions as a special production activity. (Лукьянович Н.В., 2009). Maritime transport, which forms the basis of global port operations in international trade, accounts for 80% of the physical volume of international relations and world trade, and 70% in value terms. In developed countries, 90% of international trade falls to maritime transport (Sariyev and Yadigarov, 2016.p.3-4). The volume of maritime transport in the world in 2019 will reach 19.1 trillion. USD, which is 11.08 billion tons, which is a decrease of 0.5% compared to 2018. The main reasons for this decline are the decline in demand for oil on the world market, unfavorable economic conditions and social tensions in some countries, sanctions, in Brazil 25.01. The 2019 explosion of Vale's radioactive and toxic storage facilities, the severe economic damage to iron ore and other areas caused by Cyclone Veronica in Australia in March 2019 ($ 1.2 billion) and COVID- 19 due to the impact of the pandemic (United Nations. Geneva, 2020).
In modern conditions, as maritime transport, the global infrastructure of the world economy, has become international, every country with a national fleet seeks to increase the competitiveness of maritime transport by increasing the economic efficiency of cargo transportation. From this point of view, the assessment of the development of maritime transport in the Azerbaijani economy necessitates a scientific study of the optimization of the economic activity of the Azerbaijan Caspian Shipping Company (ASCO), which unites two large fleets. Vinnikov VV, Lukyanovich NV, Kotlubay MI, Stepanech AV, Timoshek, Najder JS, Karimov A. on the problems of development of maritime transport. The scientific research of K. and others has played a major role. Although these studies examine various features of the maritime transport economy in general, as there is no extensive scientific research on the existing problems and prospects of maritime transport in Azerbaijan, the article examines the financial and economic activities of maritime transport in the country and puts forward some proposals.
The article mainly uses generalization, statistical grouping, mathematical calculation, comparative systematic analysis, analytical approach methods and econometric evaluation methods. As maritime transport is a complex economic system in the service sector, the study of development problems and prospects in this area requires a systematic approach. For this purpose, the article analyzes the issues related to the development of maritime transport in the Republic of Azerbaijan in a comprehensive approach, dividing them into related groups. During the analysis, the works of local and foreign economists on issues related to the economics of maritime transport were studied in detail. The article is based on information from the International Maritime Organization (IMO), the State Statistics Committee of the Republic of Azerbaijan, the Caspian Oil Fleet and Maritime Transport Fleet of the Azerbaijan Caspian Shipping Company, the Ministry of Economy, the Baku International Sea Trade Port and the UN Conference on Trade and Development, internet materials and reliable information sources were widely used.
2. Main part
2.1. Analysis of the current situation of "Azerbaijan Caspian Shipping" CJSC
In the economy of Azerbaijan, maritime transport plays an important role in the protection of state borders, passenger transport, offshore oil and gas production and cargo transportation for import and export operations. ASCO, which owns various types of ships for maritime transport, has a major role in boosting the competitiveness of the country's economy. Technological ships of the State Oil Company of Azerbaijan (SOCAR) are involved in offshore oil and gas production and fire protection of offshore facilities, ships operating in foreign waters are involved in international cargo transportation, and ships of the Navy are involved in strengthening the country's political and economic power. determines its importance. The main activity of the Azerbaijan Caspian Shipping Company (ASCO), established through the merger of the Azerbaijan Caspian Shipping Company and the Caspian Oil Fleet (ASCO), has been to increase the efficiency and competitiveness of maritime transport, the use of cargo and the country's transit potential. “Azerbaijan Caspian Shipping” CJSC, as a leading shipping company of the Republic of Azerbaijan, provides specialized maritime transport services, ship repair, seafarer training and certification services to the oil fleet and transport fleet, two ship repair plants, the Azerbaijan State Maritime Company. It has an Academy and a Training Center. Azerbaijan's favorable geographical position between Europe and Asia and the international cargo routes through the Caspian Sea increase the importance of the transport fleet in transit cargo transportation. Also, the role of the oil fleet of the Azerbaijan Caspian Shipping Company in the implementation of large-scale oil and gas projects in the Caspian Sea is very large. In 2019, 84.4% of the Caspian Sea Oil Fleet's revenue came from SOCAR's enterprises, 12.8% from alliances, and 2.8% from other organizations (asco.az). In 2019, in the age groups of XDND ships, ships over 25 years of age accounted for 85.8%, which means 180 ships in total. Revenues from maritime transport services amounted to 224.4 mln. manat or 80.8% fall to the share of ships belonging to this age group. Ships under the age of 10 make up 8.3% of the fleet, and ships under the age of 11-25 make up 5.7%. In contrast to the Caspian Sea Oil Fleet, the Transport Fleet accounted for 11.3% of vessels under 10 years of age, 41.5% of vessels of 11-25 years of age, and 47.2% of vessels over 25 years of age. The table below provides information on income tax, income and expenses of “Azerbaijan Caspian Shipping” CJSC in general in accordance with the relevant articles of the Tax Code (VC).
|
Periods |
2014 |
2015 |
2016 |
2017 |
2018 |
2019 |
|
Income from the provision of goods (works, services) |
261,2 |
338,6 |
469,1 |
487 |
441 |
476,7 |
|
Income from the work done and the services provided |
260,2 |
336,6 |
464,3 |
478 |
435 |
469,8 |
|
Other income |
32,81 |
26,81 |
22,11 |
29,58 |
22,02 |
27,89 |
|
General income |
293 |
363,4 |
486,4 |
508 |
457 |
495 |
|
Deduction from gross income |
4,13 |
0 |
0 |
4,1 |
0 |
3,87 |
|
Dividend paid by a resident |
0 |
0 |
0 |
0 |
0 |
2,73 |
|
Negative difference due to changes in the exchange rate of foreign currencies against the manat |
4,13 |
0 |
0 |
4,1 |
0 |
0,99 |
|
Tax-exempt income |
0 |
0 |
0 |
0 |
0 |
0,15 |
|
GENERAL INCOME AFTER DEDUCTIONS |
288,8 |
363,4 |
486,4 |
504 |
457 |
491,1 |
|
Expenses for delivery of goods (works, services) |
126,5 |
133,9 |
171,8 |
213 |
232 |
229,5 |
|
Salary and equivalent payments |
51,7 |
56,7 |
65,68 |
77,1 |
87,4 |
89,37 |
|
salaries of local workers |
51,7 |
56,7 |
65,68 |
77 |
87,4 |
89,37 |
|
Social insurance premiums |
10,11 |
11,2 |
13,51 |
16,2 |
18,7 |
19,18 |
|
Raw materials and supplies |
4,75 |
4,39 |
7,54 |
7,96 |
8,23 |
6,3 |
|
The cost of the goods |
0,2 |
0,74 |
3,9 |
7,45 |
4,03 |
4,48 |
|
Rent |
0,62 |
0,01 |
0,1 |
2,18 |
1,25 |
1,18 |
|
For legal entities |
0,62 |
0,01 |
0,1 |
2,18 |
1,25 |
1,18 |
|
Travel expenses within the norm |
4,21 |
4,58 |
9,28 |
10,4 |
11,3 |
9,84 |
|
Energy costs |
0,65 |
0,57 |
0,64 |
0,87 |
0,66 |
0,67 |
|
Gas costs |
0,02 |
0,03 |
0,03 |
0,05 |
0,04 |
0,04 |
|
Fuel costs |
35,76 |
32,55 |
34,61 |
37,4 |
42 |
40,41 |
|
Water and sewage costs |
0,54 |
0,47 |
0,7 |
0,77 |
0,8 |
0,69 |
|
Communication costs |
0,5 |
0,99 |
0,93 |
0,85 |
0,82 |
0,67 |
|
Security costs |
1,36 |
1,43 |
1,35 |
1,63 |
1,91 |
2,86 |
|
Banking expenses |
0,82 |
0,78 |
1,06 |
1,02 |
0,76 |
0,8 |
|
Advertising costs |
0,03 |
0,01 |
0,06 |
0,04 |
0 |
0,1 |
|
Other costs directly related to the supply of goods (works, services) |
15,18 |
19,43 |
32,43 |
48,6 |
53,8 |
52,93 |
|
Interest on the loan and related expenses |
0,94 |
1,84 |
1,6 |
1,44 |
1,91 |
3,3 |
|
Interest expenses and deductions |
0,94 |
1,84 |
1,6 |
1,44 |
1,91 |
3,3 |
|
other interest expenses |
0,94 |
1,84 |
1,6 |
1,44 |
1,91 |
3,3 |
|
Expenditures on scientific research, project research and experimental design work |
0,36 |
0,31 |
0,23 |
0,25 |
0,37 |
0,64 |
|
Depreciation. Allocations, expenses deducted from income on sale and liquidation of fixed assets |
135,3 |
150,1 |
158,8 |
133 |
129 |
120 |
|
Accrued depreciation on buildings, structures and facilities. |
3,15 |
2,76 |
1,88 |
2,73 |
2,71 |
2,54 |
|
Accrued depreciation on machinery, equipment and computing. |
0,81 |
1,71 |
1,39 |
1,2 |
1,92 |
1,85 |
|
Accrued depreciation on vehicles. |
129,9 |
144,1 |
154,1 |
127 |
123 |
113,9 |
|
Depreciation on intangible assets. |
0,22 |
0,2 |
0,24 |
0,32 |
0,47 |
0,65 |
|
Accrued depreciation on intangible assets with indefinite useful lives |
0,22 |
0,2 |
0,24 |
0,32 |
0,47 |
0,65 |
|
Accrued depreciation on other fixed assets |
0,78 |
0,92 |
0,45 |
0,29 |
0,54 |
0,82 |
|
The amount of the residual value of fixed assets deducted under Article 114.6 of the TC |
0,46 |
0,39 |
0,75 |
1,49 |
0,3 |
0,06 |
|
Repair costs |
6,46 |
30,29 |
26,45 |
24,8 |
23,1 |
22,32 |
|
Estimated repair costs for buildings, structures and facilities |
0,15 |
1,39 |
0,91 |
1,21 |
1,25 |
1,79 |
|
Machines, equipment and accounts. techn. account on. repair costs |
0,03 |
0,09 |
0,18 |
0,26 |
0,26 |
0,06 |
|
Vehicle account. repair costs |
6,28 |
28,75 |
25,3 |
23,2 |
21,5 |
20,42 |
|
Transportation costs |
5,18 |
5,44 |
4,55 |
7,05 |
8,36 |
6,87 |
|
Residential transportation costs |
5,18 |
5,44 |
4,55 |
7,05 |
8,36 |
6,87 |
|
Insurance costs |
1,99 |
2,4 |
3,6 |
3,04 |
3,22 |
5,17 |
|
other expenses |
2,66 |
3,75 |
5,81 |
7,46 |
8,39 |
9,65 |
|
Income taxes and levies |
6,41 |
5,4 |
5,08 |
4,84 |
4,73 |
4,88 |
|
Land tax |
0,08 |
0,16 |
0,16 |
0,18 |
0,18 |
0,18 |
|
Property tax |
6,3 |
5,24 |
4,91 |
4,66 |
4,55 |
4,71 |
|
Total expenses |
285,8 |
333,3 |
377,9 |
394 |
410 |
402,3 |
|
COSTS FROM GENERAL INCOME |
285,8 |
333,3 |
377,9 |
394 |
410 |
402,3 |
|
Profit for tax purposes |
3,06 |
30,12 |
108,5 |
110 |
46,2 |
88,83 |
|
Deduction loss of previous years |
13,15 |
10,09 |
0 |
0 |
0 |
0 |
|
Taxable profit less losses from previous years |
0 |
20,03 |
108,5 |
110 |
46,2 |
88,83 |
|
INCOME TAX |
0 |
4,01 |
21,7 |
21,9 |
9,25 |
17,77 |
|
Income tax payable |
0 |
4,01 |
21,7 |
21,9 |
9,25 |
17,77 |
|
The amount of repair costs calculated in accordance with Article 115.1 of the TC, but to be taken into account in subsequent years |
0,52 |
0 |
0 |
0 |
0 |
0,37 |
|
non-deductible expenses in accordance with the tax code |
53,6 |
34,4 |
48,45 |
143,78 |
56,62 |
56,66 |
Table 2.1.1: Income, expenses and profit tax of “Azerbaijan Caspian Shipping” CJSC for 2014-2019, mln. in manats
(Source: Compiled by the author based on Source (2) and (6))
As can be seen from the table data, ASCO's revenue from work and services in general was observed to increase in 2014-2019. 98.2-99% of income came from the provision of works and services. As part of the income, the rental income of leased vessels is 15-20%, and the income from maritime transport services, freight and passenger transportation, logistics and other services is 80-85%. It should be noted that the main part of the increase in revenue from maritime transport services fell to the share of the oil fleet for the period under review. The value of actual ship hours on the main fleet continued to increase in subsequent years compared to 2014. This increase was mainly due to the increase in indirect costs in 2017 due to the transfer of service-auxiliary and technical fleet vessels from the Maritime Transport Fleet to the balance of the oil fleet. This can be seen more clearly in the table below.
|
Years |
Caspian Sea Oil Fleet |
Maritime Transport Fleet |
||||||
|
Income, mln. AZN |
Expenses, mln. AZN |
Profit, mln. AZN |
Ship clock, in a thousand hours |
Income, mln. AZN |
Expenses, mln. AZN |
Profit, mln. AZN |
Cargo transported, thousand tons |
|
|
2009 |
124,6 |
135,6 |
-11 |
625 |
122,5 |
103,1 |
19,4 |
13190 |
|
2010 |
109,5 |
121,3 |
-11,8 |
600 |
107,2 |
92,1 |
15,1 |
11714,3 |
|
2011 |
132,4 |
129,2 |
3,2 |
569 |
109,7 |
100,5 |
9,2 |
12499,1 |
|
2012 |
149,7 |
144,7 |
5 |
569 |
114,6 |
105,1 |
9,5 |
12371,2 |
|
2013 |
195,2 |
183,2 |
12 |
583 |
97,9 |
107,5 |
-9,6 |
11509,7 |
|
2014 |
195,7 |
158,9 |
36,8 |
493 |
102,3 |
119,3 |
-17 |
9934,1 |
|
2015 |
232,6 |
180,9 |
51,7 |
505 |
94 |
154,8 |
-60,8 |
6625,9 |
|
2016 |
306,8 |
171,4 |
135,4 |
529 |
160,1 |
174 |
-13,9 |
5807,3 |
|
2017 |
305,4 |
188,6 |
116,8 |
511 |
179,7 |
162,4 |
17,3 |
8344,5 |
|
2018 |
266,6 |
196,7 |
69,9 |
498 |
170,6 |
174,7 |
-4,1 |
8236,1 |
|
2019 |
293,1 |
194,2 |
98,9 |
532 |
180,5 |
169,6 |
10,9 |
5968,7 |
Table 2.1.2. Volume of income, expenses and cargo transportation in ASCO oil and transport fleets
(Source: Compiled by the author based on Source (2) and (6))
As can be seen from the table, the total revenue of the oil fleet has increased since 2014, although the number of hours actually worked has decreased. Thus, while ship hours in 2014 decreased by 26.3% compared to 2008, revenue amounted to 67.9 million. manat increased. This growth continued in the following years, resulting in a 2.3-fold increase in maritime revenue in 2019 compared to 2008, or 165.3 million manat, due to the increase in the price per hour of ships providing maritime transport services to SOCAR. The increase in revenue at the expense of prices is due to a decrease in the number of used ship watches in 2014-2019 by 14.3-26.3% compared to 2013, and in 2014-2019 by 8.7-15.4% compared to 2013. can also be seen. The increase in revenue due to prices resulted in the level of profitability of works and services in the Caspian Oil Fleet fluctuating between 28.6% -79% in 2014-2019. In the Maritime Transport Fleet, the economic activity of the fleet has suffered as a result of a sharp decline in the volume of cargo transportation since 2014. Thus, the volume of cargo transportation in 2019 compared to 2008-2013 decreased by 48.1-54.7%. In general, the volume of cargo transportation in 2014-2019 compared to 2008-2013 amounted to 38.6% or 28265.7 million. tons decreased. As a result, the financial results of the fleet in those periods for 2008-2013 amounted to 49.9 million. manat with a profit, and in 2014-2019 - 67.6 mln. manat resulted in damage. In 2017, the transfer of service-auxiliary and technical vessels on the balance of the transport fleet to the balance of the oil fleet will reduce the cost of maintaining the transport fleet by 10 million. resulted in a profit of AZN.
2.2. Analysis of the current state of cargo transportation in the Europe-Caucasus-Asia transport corridor by sea
According to statistics, during the activity of "Azerbaijan Caspian Shipping" CJSC in 2014-2019, the volume of cargo transportation in the Europe-Caucasus-Asia transport corridor by sea decreased. Despite the intensification of cargo flows in this transport corridor, the decrease in cargo volume in the fleet was due to factors such as the age of ships and low carrying capacity, unsatisfactory level of marketing and logistics services, and inefficient time losses during transportation and handling. The table below shows the volume of freight traffic on the Europe-Caucasus-Asia transport corridor by mode of transport.
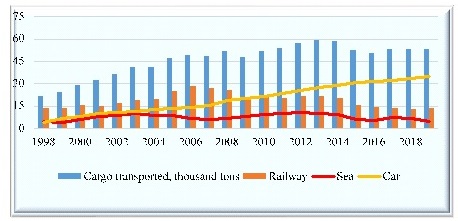
Figure 2.2.1: Cargo transportation on the Europe-Caucasus-Asia transport corridor
(Source: Compiled by the author based on Source (2))
As can be seen from the graph, freight traffic in the Europe-Caucasus-Asia transport corridor, in contrast to sea and rail transport, was observed with increasing dynamics throughout the period studied in road transport. The volume of cargo transportation by sea in 2019 decreased to 5 million tons compared to previous years, which means a 50% decrease in the volume of cargo transportation compared to 2013-2014. It should be noted that the share of maritime transport in total freight during the study period was 12.6-25%. In the Europe-Caucasus-Asia transport corridor, the share of maritime import and export cargo in total cargo fell from 47.4% (1996) to 8.8% (2019). All this can be seen more clearly in the graph below.
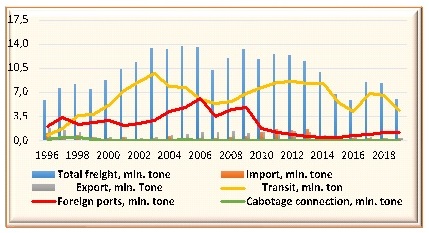
Figure 2.2.2: Cargo transportation on the Europe-Caucasus-Asia transport corridor
(Source: Compiled by the author based on Source (2))
As can be seen from the graph, the share of transit traffic in the total volume of sea freight decreased in 1996-1997 compared to freight traffic on foreign inter-port routes, but in subsequent periods it exceeded freight traffic on foreign inter-port routes. Decrease in the volume of transit traffic in 2019-2019, which accounted for 45-85% of the total freight traffic in 2001-2019, compared to 2001-2018, except for 2016, the volume of total freight traffic in maritime transport compared to 1997-2018 which resulted in a decrease of 6 million tons, which was considered to be one of the factors influencing the economic activity of the transport fleet, as well as affecting the income from the charter of ships. As can be seen from Figure 2, the economic activity of the Maritime Transport Fleet resulted in a loss of 67.6 million manat for 2013-2019, covering the activities of the Azerbaijan Caspian Shipping Company. It should be noted that one of the main reasons for the loss of economic activity of the fleet is related to the calculation of the maximum amount (25%) of the amount of depreciation applied to vehicles as part of the costs for all periods in accordance with Article 114 of the Civil Code.
2.3. Analysis of depreciation allowances for maritime transport operating costs
According to the consolidated annual financial statements of Azerbaijan Caspian Shipping CJSC, depreciation is calculated on the basis of the straight-line depreciation method applied to ships and fixed assets (ASCO's annual financial report for 2019, 2020) Estimated useful use of fixed assets Despite the fact that the term is 3-15 years for ships and port facilities, the normative service life depends on the purpose and service life of the vessels of both fleets of ASCO 550/4 project, which collects oil and fecal water (only one in the balance of the fleet). units are included in this project) 15-50 years, excluding ships (Yadigarov, p.312-313). The service life of the Ship Repair Workshop, which is on the balance of the shipping company, is 37 years (project 889A) and the service life of the floating shipyards is 50 years (Yadigarov, pp.312-313). It is known that the depreciation rate used to calculate the depreciation of fixed assets by the linear method is a percentage of their initial cost to service life. According to this norm, the amount of annual depreciation allocated from the initial cost of fixed assets is divided by 12 according to the straight-line method of depreciation and includes expenses deducted from monthly income in equal amounts. The service life of the ships included in the ASCO is 20 years, since the weighted average is 19.9 years according to the formula (Yadigarov, p.192). This means that in the calculation of the amount of depreciation according to the straight-line method of depreciation of ships in shipping, the depreciation rate should be accepted in the range of 5%, not 25%. Calculation of the depreciation rate of 25% means that the service life of ships is 4 years, which contradicts the normative service life of ships, which allows the residual value to be created for 4 years only at the expense of the cost of repair of ships in excess of the norm. In calculating the depreciation of fixed assets of ASCO, the depreciation rate set by the VM, without taking into account the standard service life of fixed assets, led to a higher share of depreciation in the cost compared to other costs. This is 67.6 million manat of DND's economic activity in 2014-2019. manat, resulting in an increase of AZN 165.17 million in shipping costs and a decrease in taxable profit by the same amount. All this has reduced the share of tax payments in income from works and services due to the reduction of shipping income tax payments for the period under study. As can be seen from the data in Table 1, the amount of income tax calculated on the basis of 2590.2 million manat of income from ASCO's works and services for 2014-2019 was 74.63 million manat, which is the share of accrued profit tax in the total income for that period. That means 3.3%.
2.4. Analysis of accrued and paid taxes on Azerbaijan Caspian Shipping CJSC and Baku International Sea Trade Port
The chart below shows the share of calculated and paid taxes to the state budget of Baku International Sea Trade Port and Azerbaijan Caspian Shipping CJSC, which form the main material and technical base of maritime transport included in the maritime transport infrastructure.
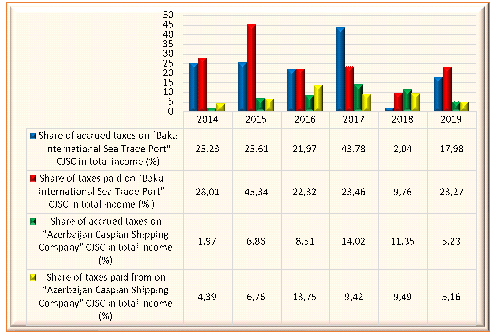
Figure 2.4.1: Share of accrued and paid taxes on income of ASCO and Baku International Sea Trade Port, in%
(Source: Compiled by the author based on Source (2) and (7))
As can be seen from Figure 3, the share of shipping taxes calculated and paid in 2014-2019 in revenues from works and services is lower than in Baku International Sea Trade Port. Thus, the share of taxes assessed in the total income for that period in "Azerbaijan Caspian Shipping" CJSC is 2.85 times lower than in Baku International Sea Trade Port, and the share of taxes paid to the state budget in total revenue is 3.1 times lower. The regression analysis of the relationship between shipping tax payments and state budget revenues for 2014-2019 also shows that there is a weak correlation between these indicators, expressed by the regression equation y = 30,726x + 2E + 07 (R² = 0.023). The calculated elasticity coefficient of indicates that a 1% increase in tax payments at Azerbaijan Caspian Shipping CJSC results in a 0.055% increase in state budget revenues. From this point of view, all expenses, including fuel and lubricants, spare parts, depreciation allowances, repair costs, and salary payments should be optimized according to Table 1, which reflects the deductible items of income of Azerbaijan Caspian Shipping CJSC. Expenditure optimization will lead to an increase in income tax payments, leading to an increase in profits.
2.5. Assessment of the impact of tax payments on “Azerbaijan Caspian Shipping” CJSC on budget revenues by types of taxes
VAT, profit tax, land tax, property tax, withholding tax paid at the source of payment related to employment, payment paid to the state budget of “Azerbaijan Caspian Shipping” CJSC for the first and second half of 2014-2019 using Eviews-10 software package If we analyze the regression between the tax withheld at the source, VAT paid on the amount paid for the unregistered non-resident and the budget revenues, we get the following result.
|
Dependent Variable: Y |
|
|
||
|
Method: Least Squares |
|
|
||
|
Date: 02/02/21 Time: 11:17 |
|
|||
|
Sample: 2014S1 2019S2 |
|
|
||
|
Included observations: 12 |
|
|
||
|
|
|
|
|
|
|
|
|
|
|
|
|
Variable |
Coefficient |
Std. Error |
t-Statistic |
Prob. |
|
|
|
|
|
|
|
|
|
|
|
|
|
X7 |
2772.698 |
1756.521 |
1.578517 |
0.7723 |
|
X6 |
5301.296 |
5253.251 |
0.307264 |
0.7787 |
|
X5 |
6214.590 |
4495.547 |
1.009146 |
0.2608 |
|
X4 |
-5881.150 |
1982.981 |
-2.965812 |
0.0593 |
|
X3 |
-93619.42 |
38501.93 |
-2.431551 |
0.0932 |
|
X2 |
53.29284 |
52.7391 |
0.080171 |
0.9411 |
|
X1 |
646.9147 |
646.6821 |
1.866017 |
0.7207 |
|
C |
29675214 |
14037531 |
2.113991 |
0.1249 |
|
|
|
|
|
|
|
|
|
|
|
|
|
R-squared |
0.912680 |
Mean dependent var |
9704792. |
|
|
Adjusted R-squared |
0.679827 |
S.D. dependent var |
2134247. |
|
|
S.E. of regression |
1207638. |
Akaike info criterion |
30.95994 |
|
|
Sum squared resid |
4.38E+12 |
Schwarz criterion |
31.32362 |
|
|
Log likelihood |
-176.7596 |
Hannan-Quinn criter. |
30.82529 |
|
|
F-statistic |
13.91956 |
Durbin-Watson stat |
2.087447 |
|
|
Prob(F-statistic) |
0.144339 |
|
|
|
|
|
|
|
|
|
|
|
|
|
|
|
Table 2.5.1: Results of the regression analysis of ASCO types of taxes paid to the state budget for the first and second half of 2014-2019 and state budget revenues
(Source: Eviews-10 application was developed by the author based on the software package.)
According to the Eviews-10 application software package, the relevant regression model is expressed by the following regression equation.

If we check the statistical significance of the model using the F-Fisher criterion, Fcard(a;m;n - m - 1) = FPACП(0,05;7;12 - 7 - 1) = 5,91 is obtained. Since F - Fiser > Fcard , the regression equation is of statistical importance as a whole (Hasanli Y.H., 2008, p.98). According to Table 3, let's check the result on autocorrelation based on Darbin-Watson statistics. at the level of a - 0,05 importance will be dl = 0,171 <DW=2,087 < 3,149, because there are points of crisis Darbin-Watson (Borodich SA, 2006). This means that no conclusion has been drawn about the existence of autocorrelation (Stock J.H., Watson M.W., 2010). If we calculate the elasticity coefficient for the linear regression equation (1), we can see that a 1% increase in VAT paid to the state budget of Azerbaijan Caspian Shipping CJSC increases budget revenues by 0.0081%, a 1% increase in income tax increases budget revenues by 0.00033 %, a 1% increase in land tax and property tax reduces budget revenues by 0.0008% and 0.0002%, respectively, a 1% increase in employment withholding tax increases budget revenues by 0.0034%, a 1% increase in withholding tax increase increases budget revenues by 0.0063%. As can be seen, a 1% increase in shipping taxes (property and land taxes) reduces budget revenues by 0.001% for these taxes as a whole. This decrease is explained by the low share of calculated and paid taxes on shipping in state budget revenues. As can be seen from the table, the share of profit tax payments of Azerbaijan Caspian Shipping CJSC in the state budget revenues in 2014-2019 and the first half of 2020 is higher than other types of taxes with 0.07%. From this point of view, increasing the level of profitability and profitability of the fleet as a whole is important and contributes to improving the competitiveness of shipping. Along with the allocation of depreciation on the economic activities of the shipping, including cost items, fuel and lubricants, raw materials and spare parts, logistics costs, port costs, repair and maintenance costs, salary system and other costs, as well as "Azerbaijan Caspian Sea Shipping” requires optimization of CJSC's rental income.
2.6. Risk assessment of capital investments in shares issued on the Caspian Sea Oil Fleet
A decrease in the profit of each enterprise may result in the possible price of dividends per share being higher than the expected amount of dividends. This results in a greater exposure to risk than equity investments. According to the consolidated annual financial statements of Azerbaijan Caspian Shipping CJSC, the share capital group includes 15 companies with independent legal status, each with its own share capital. On 31.12.2019, Azerbaijan Caspian Shipping CJSC approved the issue of 440050998 shares with a nominal value of 1 Azerbaijani manat. These shares were issued to the State, which is the sole and final shareholder of the group.Since the economic activity of the Maritime Transport Fleet in 2014-2019 resulted in losses, it is possible to determine the extent of the risk of capital investments in shares that can be held only on the basis of the profits of the oil fleet for those periods. Borodic S.A. (2006, p. 45) notes that when analyzing the amount of dividends on the shares of any company, the risk of capital investment is assessed by the coefficient of variation. From this point of view, the coefficient of variation can be used to determine the degree of risk of capital investment in possible shares. Since the distribution of dividends on a company's shares is determined on the basis of earnings, the expected amount of dividends will depend on the expected amount of earnings.
The coefficient of variation is a percentage of the standard deviation of the sample mean and is calculated according to the formula ![]() (Yadigarov TA, 2020, p.120). Here, the V-coefficient of variation, -the standard deviation, is the mathematical expectation of the random variable X, which is the numerical mean of the observed values of the sample.
(Yadigarov TA, 2020, p.120). Here, the V-coefficient of variation, -the standard deviation, is the mathematical expectation of the random variable X, which is the numerical mean of the observed values of the sample.
In statistical studies, the numerical mean of the observed values of the sample as the mathematical expectation of the random variable X calculated by the formula 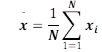 , the variance of the random variable X calculated by the formula
 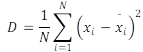 , and the standard deviation of the sample variance expressed by the formula
 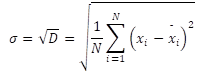 , If we calculate on, we
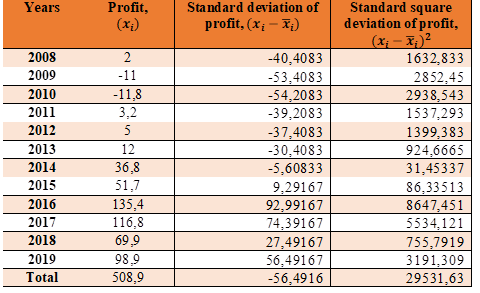
Table 2.6.1. Profit of the Caspian Sea Oil Fleet for 2008-2019, its standard and standard deviation
(Source: Compiled based on ASCO data and author's calculations)
If we calculate the coefficient of variation using the data in Table 2, we get the following result.
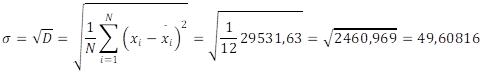
In this case, the coefficient of variation will be ![]()
Here, ![]()
The coefficient of variation of 117% indicates that the scattering of the actual possible amount of profit of the Caspian Oil Fleet for 2008-2019 exceeds the expected amount of profit. This means that the risk will be more noticeable than the capital investment of Azerbaijan Caspian Shipping CJSC in the shares of the oil fleet. In the Maritime Transport Fleet, however, this increases the risk factor as a whole, as the results of economic activities result in losses for the period under study
3. Conclusion
The current problems of the development of maritime transport in the economy of Azerbaijan show that one of the most important issues in the process of integration of our country into the world transport system in order to increase the efficiency of maritime transport is to ensure optimal export of maritime transport services. In this regard, the implementation of the following proposals can contribute to a systematic solution to increase the efficiency of maritime transport development in the Azerbaijani economy.
- In order to increase the volume of cargo transportation on the Europe-Caucasus-Asia (TRACECA) international transport corridor, the transport and logistics system in Azerbaijan Caspian Shipping CJSC should be optimized, the efficiency of qualified personnel in the management system should be increased;
- In order to increase the profitability of work and services in the Maritime Transport Fleet, inefficient time losses should be reduced, optimal models of ship operating costs, movement schemes should be established using economic-mathematical methods and efficiency of cargo transportation should be increased;
- According to the straight-line depreciation method applied in the calculation of the depreciation amount of fixed assets in “Azerbaijan Caspian Shipping” CJSC, the depreciation rate should be calculated taking into account the normative service life of fixed assets. In this case, shipping expenses decreased by 24-31.7 million manat per year, along with additional tax payments to the state budget on profit tax in the amount of 4.8-6.35 million manat, to reduce the risk of capital investments in shares of the Caspian Oil Fleet. conditions can be created;
- In the formation of income from the work and services of the Caspian Oil Fleet, which provides maritime transport services to SOCAR by Azerbaijan Caspian Shipping CJSC, the tariff prices of ships should be determined by cargo turnover, not by 1 ship * hour by ship groups. In this case, the income of the Caspian Sea Oil Fleet from works and services is 17-20% of offshore oil and gas production costs, which can lead to optimal management of financial and economic activities of the shipping industry, along with reducing the cost of oil and gas production;
- In order to increase the competitiveness of maritime transport in Azerbaijan, ships older than 20 years should be replaced by ships with higher carrying capacity. For this purpose, it is more expedient in the current situation to build ships abroad, as the entry of ships with a carrying capacity of only 5,000 tons into foreign triads through the Volga-Don canal pays a high fare, which reduces the competitiveness of shipping in Azerbaijan;
-As Caspian Sea Shipping CJSC's vessels do not have seawater washing devices for harmful gases, the CIS does not restrict the operation of vessels and install special devices (scrubbers) to clean ecological waste with seawater in accordance with the requirements of the CIS in order to meet the environmental standards are appropriate.
4. References
1. Consolidated financial statements of “Azerbaijan Caspian Shipping” Closed Joint-Stock Company. Together with the Independent Auditor's Report for the year ended 31 December 2019, 17 March 2020, p. 46
2. State Statistics Committee of the Republic of Azerbaijan. https://www.stat.gov.az/ sourcr / transport /. Reference date: January 18, 2021.
3. Borodich S.A. Econometrics. Minsk: New Knowledge, 2006. 416 p.
4. Hasanli, Y.H. Introduction to Econometrics. Textbook. Baku.2008, 236 p.
5. https://unctadstat.unctad.org/EN/. Reference date: January 10, 2021.
6. https://asco.az/. Reference date: January 08, 2021
7. https://www.taxes.gov.az: January 08, 2021
8. Kotlubay MI Establishment of marine transport in the market environment: Monograph /M.I. Kotlubay. Odessa: IPREEI NAN Ukraine, 2005. 224 p.
9. Lukyanovich NV Sea transport in the world economy. Moscow: Morkniga. 2009, 162 p.
10.Najder J., Transportation, PWE, Warsaw 2012.
11. Neider J., Polish ports of the sea. University of Gdansk Publishing House, Gdansk 2008.
12. Sariyev AB, Yadigarov T.A. Maritime transport in Azerbaijan: problems, prospects. "Respublika" newspaper, November 29 - December 4, 2016
13. Stock J.H.,Watson M.W.Introduction to Econometrics.3 rd edition,Addison-Wesley, 2010. 840 p
14. Timoshek E. С. Naval Operations Management: Textbook. allowance. - Vladivostok, 2011
15. United Nations Conference on trade and development. "Impact of the COVİD-19 Pandemic on Trade and Development" transition to a new normal. United Nations. Geneva, 2020. https://unctad.org/system/files/official-document/osg2020d1_en.pdf. Reference date: January 12, 2021.
16. Yadigarov T.A. Maritime transport in the Azerbaijani economy: problems and prospects. (Monograph) Baku, European Publishing House, 2018,340 pages.
17. Yadigarov T.A. Operations research and solution of econometric problems in MS Excel and Eviews software packages: theory and practice. (Monograph) Baku-2020. 352 p.
18. Yadigarov T.A. "Customs statistics and modern information technologies". (Monograph) Baku, "Europe" publishing house, 2020-520 pages.